GAME 1
GAME 2
GAME 3
GAME 4
GAME 5
GAME 6
martes, 20 de febrero de 2018
lunes, 19 de febrero de 2018

Pon a prueba tus conocimientos de Geografía
Con este juego interactivo podrás poner a prueba tus conocimientos de Geografía todas las veces que quieras...

RENEWABLE ENERGY
Wind energy
Wind is produced as a result of giant convection currents in the Earth's atmosphere, which are driven by heat energy from the Sun. This means that the kinetic energy in wind is a renewable energy resource - as long as the Sun exists, the wind will too.
Wind turbines
Wind turbines use the wind to drive turbines directly. They have huge blades mounted on a tall tower. The blades are connected to a 'nacelle', or housing, which contains gears linked to a generator. As the wind blows, it transfers some of its kinetic energy to the blades, which turn and drive the generator. Several wind turbines may be grouped together in windy locations to form wind farms.
Advantages
- Wind is a renewable energy resource and there are no fuel costs.
- No harmful polluting gases are produced.
Disadvantages
- Wind farms are noisy and may spoil the view for people living near them.
- The amount of electricity generated depends on the strength of the wind.
- If there is no wind, there is no electricity.
Water energy
Like the wind, water can be used to drive turbines directly. There are several ways that water can be used, including waves, tides and falling water in hydroelectric power schemes.
Wave
The water in the sea rises and falls because of waves on the surface.Wave machines use the kinetic energy in this movement to drive electricity generators.
Tides
Huge amounts of water move in and out of river mouths each day because of the tides. A tidal barrage is a barrier built over a river estuary to make use of the kinetic energy in the moving water. The barrage contains electricity generators, which are driven by the water rushing through tubes in the barrage.
Hydroelectric power
Like tidal barrages, hydroelectric power (HEP) stations use thekinetic energy in moving water. But the water comes from behind a dam built across a river valley. The water high up behind the dam contains gravitational potential energy. This is transferred to kinetic energy as the water rushes down through tubes inside the dam. The moving water drives electrical generators, which may be built inside the dam.
Advantages
- Water power in its various forms is a renewable energy resource and there are no fuel costs.
- No harmful polluting gases are produced.
- Tidal barrages and hydroelectric power stations are very reliable and can be easily switched on.
Disadvantages
- It has been difficult to scale up the designs for wave machines to produce large amounts of electricity.
- Tidal barrages destroy the habitat of estuary species, including wading birds.
- Hydroelectricity dams flood farmland and push people from their homes.
- The rotting vegetation underwater releases methane, which is a greenhouse gas.
Geothermal energy
Hot water and steam from deep underground can be used to drive turbines: this is called geothermal energy. Geothermal and nuclear energy are the only energy resources that do not come from the Sun.
Volcanic areas
Several types of rock contain radioactive substances such as uranium. Radioactive decay of these substances releases heat energy, which warms up the rocks. In volcanic areas, the rocks may heat water so that it rises to the surface naturally as hot water and steam. Here the steam can be used to drive turbines and electricity generators.
Geothermal power stations are located in places such as Iceland,California and Italy.
Hot rocks
In some places, the rocks are hot, but no hot water or steam rises to the surface. In this situation, deep wells can be drilled down to the hot rocks and cold water pumped down. The water runs through fractures in the rocks and is heated up. It returns to the surface as hot water and steam, where its energy can be used to drive turbines and electricity generators. The diagram shows how this works.
How a generating station creates energy
Advantages
- Geothermal energy is a renewable energy resource and there are no fuel costs.
- No harmful polluting gases are produced.
Disadvantages
- Most parts of the world do not have suitable areas where geothermal energy can be exploited.
Solar heating
Solar energy is used to generate electricity and to produce hot water. Solar energy is energy released by nuclear fusion in the Sun.
Solar cells
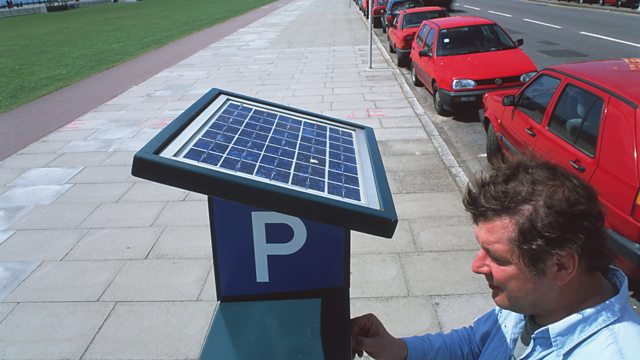
A solar-powered ticket machine
Solar cells are devices that convert light energy directly into electrical energy. You may have seen small solar cells in calculators. Larger arrays of solar cells are used to power road signs in remote areas, and even larger arrays are used to power satellites in orbit around Earth.
Advantages
- Solar energy is a renewable energy resource and there are no fuel costs.
- No harmful polluting gases are produced.
Disadvantages
- Solar cells are expensive and inefficient, so the cost of their electricity is high.
- Solar cells do not work at night.

LEARN MORE ABOUT POPULATION
Activities

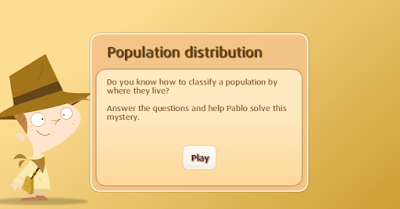

Videos


Where is Europe?
Europe is one of the seven continents of the world.
Around 739 million people lived in Europe in 2010. This makes it the third most populated continent.
11% of the world's population lives in Europe. It is the world's second smallest continent, with only 10% of the world's land area. This means it has a high population density compared to other continents.
There are about 50 countries in Europe - with Russia and Turkey being partly in Europe and partly in Asia. Iceland and Norway to the north have very different environments to the warmer areas of Cyprus and Greece to the far south of the continent.
POPULATION PYRAMIDS
This is an interesting way to see how the Spanish Population is changing...

Aprende más sobre las Pirámides de Población (español)
Causes and rates of change
The three main causes of population change
- Births - usually measured using the birth rate (number of live births per 1,000 of the population per year).
- Deaths - usually measured using the death rate (number of deaths per 1,000 of the population per year).
- Migration - the movement of people in and out of an area.
Rate of change
Births and deaths are natural causes of population change. The difference between the birth rate and the death rate of a country or place is called the natural increase. The natural increase is calculated by subtracting the death rate from the birth rate.
natural increase = birth rate - death rate
Population structure and population pyramids
Population structure means the 'make up' or composition of a population. Looking at the population structure of a place shows how the population is divided up between males and females of different age groups.
Population structure is usually shown using a population pyramid. A population pyramid can be drawn up for any area, from a whole continent or country to an individual town, city or village.
The following graphs show the population pyramids of an MEDC (the UK) and an LEDC (Mozambique), for 2000 and in 2025 using projected figures. The left side of each pyramid shows the number of men in each age group, the right side shows the number of women in each age group.

Notice how in the UK 2000 pyramid there is a bulge in the area of the 30-34 and 35-39 age groups, with the numbers thereafter reducing fairly steadily as the ages increase. This matches stage 4 of the demographic transition model.

Compare this to the 2025 pyramid, which would be stage 5 in the model. Here the bulge extends much further, covering the age groups 30-64, with the numbers beginning to reduce significantly only after 64.
Now compare the UK population pyramids with those for Mozambique:

In this graph, notice that in 2000 the 0-4 age group contained the largest number of people, with the numbers thereafter declining steadily as the ages increase. The graph matches stage 1 in the model.

In the second graph, the largest group in Mozambique in 2025 is still the 0-4 age group, but there are nearly as many people in the 5-29 age groups. Now the population pyramid matches stage 2.
Analysing population pyramids
Key things to know about population pyramids
- The shape of a population pyramid can tell us a lot about an area's population.
- It gives us information about birth and death rates as well as life expectancy.
- A population pyramid tells us how many dependants there are. There are two groups of dependants; young dependants (aged below 15) and elderly dependants (aged over 65).
- Dependants rely upon the economically active for economic support.
- Many LEDCs have a high number of young dependants, whilst many MEDCs have a growing number of elderly dependants.
How do pyramids change over time?
- A population pyramid that is very triangular (eg Mozambique in 2000) shows a population with a high number of young dependants and a low life expectancy.
- A population pyramid that has fairly straight sides (more like a barrel) shows a population with a falling birth rate and a rising life expectancy.
- Over time, as a country develops, the shape changes from triangular to barrel-like.
- Places with an ageing population and a very low birth rate would have a structure that looks like an upside-down pyramid.
martes, 13 de febrero de 2018
domingo, 11 de febrero de 2018
KET and PET SPEAKING
KET - Watch this video
PET
How to
improve your PET Speaking, Part 2
PET
Top Tips for Preparing for the
Cambridge PET Speaking Exam
How to
improve your PET Speaking, Part 2
Asking your partner
· What do you think?
· Do you agree?
· What’s your opinion?
· Would you like to ……?
· Do you think so?
· Should we …….?
Agreeing
· Absolutely
· Definitely. That’s a good
point.
· Good idea. I never thought of
that.
· Yeah, you’re right.
· Me too.
Disagreeing
· Hmm, I’m not sure.
· I don’t think so.
· On the other hand, ...
· A better idea might be ...
· I think it’d
be better if …
Giving your opinion
· I think that …. (we should go
to the cinema.)
· I’d say … (a computer is
better than a TV.)
· I’m pretty sure that … (he
would like a new watch.)
How to improve PET Speaking, Part 3
Referring to the photo
· At the top
· At the bottom
· On the left (hand side)
· On the right (hand side)
· In the middle
· In the background
· In the foreground
Describing the picture
·
The scene. E.g., “It's a picture of a very busy
classroom.”
·
What the people are wearing.
·
What they are
doing.
·
What objects you can see in the picture.
·
And how the people are using them.
Speculating
·
It could be a classroom or a busy
library.
·
She looks like a teacher but could be a
librarian.
·
They might be studying for an example.
·
Maybe they are studying for an exam.
·
It must be a library.
Referring to yourself
·
For me, ....
·
In my experience, ...
·
When I was ...
·
When I am ...
·
In my opinion
..
Suscribirse a:
Entradas (Atom)